Enterprise
Elassandra Enterprise plugin provides advanced features:
- Elasticsearch query through CQL.
- Elasticserach JMX management and monitoring.
- SSL encryption for Elasticsearch connections.
- Authentication, Authorization and Accounting for Elasticsearch.
- Elasticsearch Content-Based security.
See strapdata for more details.
License management
Enterprise plugin require a valid license. When you start your first a node with the Enterprise plugin enabled, a 30 day license is generated with all feature enabled. If you need more time to evaluate the product, you can request for a free another 30 days trail license or purchase a souscription including technical support for Elassandra. If your license expires, the enterprise plugin operates in a restricted mode until a valid license is installed.
| Feature | Description | Restricted mode |
|---|---|---|
| CQL | Elasticsearch query through CQL directly from the cassandra driver | Disabled on restart following license expiration. |
| JMX | JMX monotoring of Elasticsearch indices | Node restart required to see new index metrics, JMX attributes become read-only |
| SSL | SSL encryption of Elasticsearch connections | |
| AAA | User Authentication, Authorization and Audit | Node restart required to reload users’privileges, no more audit trails. |
| CBS | Content-Based Security rules | Node restart required to reload users’privileges. |
Caution
If the number of nodes of licensed datacenters becomes greater than your license maximum number of nodes, the license becomes invalid on all your nodes.
License installation
Licenses are stored in a Cassandra table elastic_admin.licenses. You can also put a conf/license.json file, this file is automatically loaded at boot time if elastic_admin.licenses is empty.
cassandra@cqlsh> select * from elastic_admin.licenses;

 id                                   | clustername | company | datacenters | email           | expire                          | features                     | generated                       | issuer    | maxnodes | production | signature                                                                                      | start                           | type
--------------------------------------+-------------+---------+-------------+-----------------+---------------------------------+------------------------------+---------------------------------+-----------+----------+------------+------------------------------------------------------------------------------------------------+---------------------------------+-------
 bbbef903-bbea-401d-838d-faf696e53547 | TestCluster | thecorp |     ['DC1'] | contact@thecorp | 2018-10-01 22:00:00.000000+0000 | ['JMX', 'SSL', 'AAA', 'CBS'] | 2017-10-02 13:23:09.227000+0000 | Strapdata |        3 |      False | 0x302c02141404c757c3d0e387a8f6194669d5b0a677fbb82102145b88c2785ffabc26b3aa9df72ba03b65f4a829fe | 2017-10-01 22:00:00.000000+0000 | TRIAL
Checking your license
You can use the REST license API to check the currenly active license. If your current configuration require SSL encryption and user authentication, you must provide a valid login, password and root CA certificate.
$ curl --user <username>:<password> --cacert conf/cacert.pem -XGET "https://localhost:9200/_license?pretty"
{
  "id" : "bbbef903-bbea-401d-838d-faf696e53547",
  "issuer" : "Strapdata",
  "company" : "thecorp",
  "email" : "contact@thecorp",
  "generated" : "2017-10-02T13:23:09.227Z",
  "start" : "2017-10-01T22:00:00.000Z",
  "expire" : "2018-10-01T22:00:00.000Z",
  "production" : false,
  "max_nodes" : 3,
  "cluster_name" : "TestCluster",
  "datacenters" : [
    "DC1"
  ],
  "type" : "TRIAL",
  "features" : [
    "JMX",
    "SSL",
    "AAA",
    "CBS"
  ],
  "status" : "valid",
  "signature" : "0x302c02141404c757c3d0e387a8f6194669d5b0a677fbb82102145b88c2785ffabc26b3aa9df72ba03b65f4a829fe"
}
Upgrading your license
You can update your licence by inserting additional license row in the Cassandra elastic_admin.licenses table.
cassandra@cqlsh> INSERT INTO elastic_admin.licenses JSON '{"id":"bb0a181c-dbc6-4255-8d69-67b6e1d276ce","issuer":"Strapdata","company":"thecorp","email":"contact@thecorp","type":"TRIAL","features":["JMX","SSL","AAA"],"production":false,"generated":"2017-09-26 09:10:15.604Z","start":"2017-09-25 22:00:00.000Z","expire":"2018-09-25 22:00:00.000Z","clustername":"TestCluster","datacenters":["DC1"],"maxnodes":1,"signature":"0x302d02140b49e8c00b3606c66fe22378acb1ab781410460d02150092b666041dd97887b7d624fd6a12bbd434a955ed"}';
Then reload the license with a POST REST request as shown below, each nodes returns its active license If you have several licenses in elastic_admin.licenses, the most recenlty generated valid license is used.
$ curl --user <username>:<password> --cacert <path/to/cacert.pem> -XPOST "https://localhost:9200/_license?pretty"
{
  "_nodes" : {
    "total" : 2,
    "successful" : 2,
    "failed" : 0
  },
  "cluster_name" : "TestCluster",
  "nodes" : {
    "d607917d-8c68-4cc5-8dc2-2aa21f5ea986" : {
      "name" : "127.0.0.2",
      "license_id" : "bbbef903-bbea-401d-838d-faf696e53547"
    },
    "a1c5307c-5f5a-4676-a6f0-50f221dd655b" : {
      "name" : "127.0.0.1",
      "license_id" : "bbbef903-bbea-401d-838d-faf696e53547"
    }
  }
}
Tip
If you have several Elasticsearch clusters in your Cassandra cluster, reload the license on each datacenter where Elasticsearch is enabled.
Search through CQL
To enable Elasticsearch query over CQL:
- Add the following system property to your cassandra-env.sh and restart your nodes :
JVM_OPTS="$JVM_OPTS -Dcassandra.custom_query_handler_class=org.elassandra.index.ElasticQueryHandler"
- Add a dummy column
es_queryto your cassandra table. - Add a dummy column
es_optionsto your cassandra table if you need to specify some specific options like target index names.
ALTER TABLE twitter.tweet ADD es_query text;
ALTER TABLE twitter.tweet ADD es_options text;
Then you can query the associated Elasticsearch index directly in a CQL SELECT request like this (document _type is the cassandra table name).
cassandra@cqlsh> SELECT "_id",foo FROM twitter.tweet WHERE es_query='{"query":{"query_string":{"query":"bar2*"}}}';

 _id | foo
-----+-------
   2 |  bar2
  20 | bar20
  22 | bar22
  23 | bar23
  24 | bar24
  28 | bar28
  21 | bar21
  25 | bar25
  26 | bar26
  27 | bar27

(10 rows)
By default, an elasticsearch query returns the first 10 results, but you can request more or less results with the LIMIT clause.
cassandra@cqlsh> SELECT "_id",foo FROM twitter.tweet WHERE es_query='{"query":{"query_string":{"query":"bar2*"}}}' LIMIT 3;

 _id | foo
-----+-------
   2 |  bar2
  20 | bar20
  22 | bar22

(3 rows)
If paging is enabled on your Cassandra driver and you request more results than your page size, Elassandra use an elasticsearch scrolled search request to retreive all results. Default scoll timeout is 60 seconds.
If all partition key columns are set in the where clause, elasticsearch query is directly sent to a node hosting the data (no fan out).
cassandra@cqlsh> SELECT "_id", foo FROM twitter.tweet WHERE es_query='{"query":{"query_string":{"query":"bar2*"}}}' AND "_id"='2';

 _id | foo
-----+------
   2 | bar2

(1 rows)
Cassandra functions and User Defined Functions can be used in the CQL projection clause.
cassandra@cqlsh> SELECT "_id",foo,token("_id"),writetime(foo) FROM twitter.tweet WHERE es_query='{"query":{"query_string":{"query":"bar2*"}}}';

 _id | foo   | system.token(_id)    | writetime(foo)
-----+-------+----------------------+------------------
   2 |  bar2 |  5293579765126103566 | 1509275059354000
  20 | bar20 |  4866192165766252016 | 1509275059572000
  22 | bar22 |  5315788262387249245 | 1509275059591000
  23 | bar23 |  5502885531913083742 | 1509275059600000
  24 | bar24 |  5568379873904613205 | 1509275059614000
  28 | bar28 |  3168262793124788288 | 1509275059663000
  21 | bar21 | -3201810799627846645 | 1509275059580000
  25 | bar25 |  2509205981756244107 | 1509275059625000
  26 | bar26 | -6132418777949225301 | 1509275059633000
  27 | bar27 |  9060526884622895268 | 1509275059645000

(10 rows)
If your target index does not have the same name as the underlying keyspace, you can specify targeted indices names in es_options.
cassandra@cqlsh> SELECT "_id",foo FROM twitter.tweet WHERE es_query='{"query":{"query_string":{"query":"bar2*"}}}' AND es_options='indices=twitter*';
Elasticsearch aggregations through CQL
Elassandra supports elasticsearch aggregation only in regular CQL statements. In this case :
- Returned columns are named with aggregations names.
- CQL function are not supported.
- CQL projection clause, limit and pagination are ignored. This also implies that aggregation results must fit into the available memory.
cassandra@cqlsh> SELECT * FROM twitter2.doc WHERE es_query='{"aggs":{"sales_per_month":{"date_histogram":{"field":"post_date","interval":"day"},"aggs":{"sales":{"sum":{"field":"price"}}}}}}';

 sales_per_month.key             | sales_per_month.count | sales_per_month.sales.sum
---------------------------------+-----------------------+---------------------------
 2017-10-04 00:00:00.000000+0000 |                     3 |                        30
 2017-10-05 00:00:00.000000+0000 |                     1 |                        10
 2017-10-06 00:00:00.000000+0000 |                     1 |                        10
 2017-10-07 00:00:00.000000+0000 |                     3 |                        30

(4 rows)
When requesting multiple sibling aggregations, the tree result is flattened. In the following example, there is two top level aggregations named sales_per_month and sum_monthly_sales.
cassandra@cqlsh> SELECT * FROM twitter2.doc WHERE es_query='{"size":0,
      "aggs":{"sales_per_month":{"date_histogram":{"field":"post_date","interval":"day"},"aggs":{"sales":{"sum":{"field":"price"}}}},
      "sum_monthly_sales":{"sum_bucket":{"buckets_path":"sales_per_month>sales"}}}}';

 sales_per_month.key             | sales_per_month.count | sales_per_month.sales.sum | sum_monthly_sales.value

---------------------------------+-----------------------+---------------------------+-------------------------
 2017-10-04 00:00:00.000000+0000 |                     3 |                        30 |                    null
 2017-10-05 00:00:00.000000+0000 |                     1 |                        10 |                    null
 2017-10-06 00:00:00.000000+0000 |                     1 |                        10 |                    null
 2017-10-07 00:00:00.000000+0000 |                     3 |                        30 |                    null
                            null |                  null |                      null |                      80

(5 rows)
Distributed Elasticsearch aggregation with Apach Spark
In order to use Elasticsearch aggregation capabilities from Apache Spark, you must request Elassandra with a projection clause having the same CQL types as the returned aggregation results. Moreover, don’t reuse the same column name more than once, otherwise you could get an IndexOutOfBoundsException while Apache Spark parse the result. In the following exemple, we used dummy columns count2, dc_power1, dc_power2 and dc_power3 to fit the aggregation results :
import org.apache.spark.{SparkConf, SparkContext}
import com.datastax.spark.connector._
import org.apache.spark.sql.cassandra._
val query = """{
  "query":{
    "bool":{
      "filter": [
        {"term": { "datalogger_name": "mysensor" }},
        {"range" : {
            "ts" : { "gte" : "2017-12-16", "lte" : "2018-01-20"  }
        }}
      ]
    }
  },
  "aggs":{
    "hour_agg":{
      "date_histogram":{"field":"ts","interval":"hour"},
      "aggs": {
        "agg_irradiance": {
          "avg": {
            "field": "irradiance"
          }
        },
        "agg_conso": {
          "avg": {
            "field": "altitude"
          }
        },
       "water1":{
            "terms":{"field":"azimuth"},
            "aggs":{
              "dc_power_agg":{ "sum":{"field":"dc_power"}}
            }
       }
      }
    }
  }
}"""
val t = sc.cassandraTable("iot", "sensors").select("ts","count","dc_power","dc_power1","dc_power2","count2","dc_power3").where("es_query='"+query+"'");
t.collect.foreach(println)

CassandraRow{ts: 2017-12-31 00:00:00+0100, count: 204, dc_power: 0.0, dc_power1: null, dc_power2: 305.64675177506786, count2: 17, dc_power3: 0.0}
CassandraRow{ts: 2017-12-31 00:00:00+0100, count: 204, dc_power: 0.0, dc_power1: null, dc_power2: 308.4126297573829, count2: 17, dc_power3: 0.0}
CassandraRow{ts: 2017-12-31 00:00:00+0100, count: 204, dc_power: 0.0, dc_power1: null, dc_power2: 311.4319809865401, count2: 17, dc_power3: 0.0}
CassandraRow{ts: 2017-12-31 00:00:00+0100, count: 204, dc_power: 0.0, dc_power1: null, dc_power2: 314.7328283387269, count2: 17, dc_power3: 0.0}
CassandraRow{ts: 2017-12-31 00:00:00+0100, count: 204, dc_power: 0.0, dc_power1: null, dc_power2: 318.34321582364055, count2: 17, dc_power3: 0.0}
CassandraRow{ts: 2017-12-31 00:00:00+0100, count: 204, dc_power: 0.0, dc_power1: null, dc_power2: 322.28910238170704, count2: 17, dc_power3: 0.0}
CassandraRow{ts: 2017-12-31 00:00:00+0100, count: 204, dc_power: 0.0, dc_power1: null, dc_power2: 326.59122459682067, count2: 17, dc_power3: 0.0}
CassandraRow{ts: 2017-12-31 00:00:00+0100, count: 204, dc_power: 0.0, dc_power1: null, dc_power2: 331.2608198139219, count2: 17, dc_power3: 0.0}
CassandraRow{ts: 2017-12-31 00:00:00+0100, count: 204, dc_power: 0.0, dc_power1: null, dc_power2: 336.2944302705681, count2: 17, dc_power3: 0.0}
Alternatively, you can request Apache Spark to get aggregation results as JSON objects by adding the option json=true to the query es_options as follow :
val t = sc.cassandraTable("iot", "sensors").select("es_query").where("es_query='"+query+"' AND es_options='json=true'");
t.collect.foreach(println)

CassandraRow{es_query: {"key_as_string":"2017-12-30T23:00:00.000Z","key":1514674800000,"doc_count":204,"agg_irradiance":{"value":0.0},"water1":{"doc_count_error_upper_bound":0,"sum_other_doc_count":34,"buckets":[{"key":305.64675177506786,"doc_count":17,"dc_power_agg":{"value":0.0}},{"key":308.4126297573829,"doc_count":17,"dc_power_agg":{"value":0.0}},{"key":311.4319809865401,"doc_count":17,"dc_power_agg":{"value":0.0}},{"key":314.7328283387269,"doc_count":17,"dc_power_agg":{"value":0.0}},{"key":318.34321582364055,"doc_count":17,"dc_power_agg":{"value":0.0}},{"key":322.28910238170704,"doc_count":17,"dc_power_agg":{"value":0.0}},{"key":326.59122459682067,"doc_count":17,"dc_power_agg":{"value":0.0}},{"key":331.2608198139219,"doc_count":17,"dc_power_agg":{"value":0.0}},{"key":336.2944302705681,"doc_count":17,"dc_power_agg":{"value":0.0}},{"key":341.6684918842001,"doc_count":17,"dc_power_agg":{"value":0.0}}]},"agg_conso":{"value":0.0}}}
CassandraRow{es_query: {"key_as_string":"2017-12-31T00:00:00.000Z","key":1514678400000,"doc_count":204,"agg_irradiance":{"value":0.0},"water1":{"doc_count_error_upper_bound":0,"sum_other_doc_count":34,"buckets":[{"key":5.253033308292965,"doc_count":17,"dc_power_agg":{"value":0.0}},{"key":11.17937932261813,"doc_count":17,"dc_power_agg":{"value":0.0}},{"key":16.9088341251606,"doc_count":17,"dc_power_agg":{"value":0.0}},{"key":22.361824055627704,"doc_count":17,"dc_power_agg":{"value":0.0}},{"key":27.483980631203153,"doc_count":17,"dc_power_agg":{"value":0.0}},{"key":32.24594386978638,"doc_count":17,"dc_power_agg":{"value":0.0}},{"key":36.63970141314307,"doc_count":17,"dc_power_agg":{"value":0.0}},{"key":40.673315954868855,"doc_count":17,"dc_power_agg":{"value":0.0}},{"key":44.36558478428467,"doc_count":17,"dc_power_agg":{"value":0.0}},{"key":47.74149653565296,"doc_count":17,"dc_power_agg":{"value":0.0}}]},"agg_conso":{"value":0.0}}}
CassandraRow{es_query: {"key_as_string":"2017-12-31T01:00:00.000Z","key":1514682000000,"doc_count":204,"agg_irradiance":{"value":0.0},"water1":{"doc_count_error_upper_bound":0,"sum_other_doc_count":34,"buckets":[{"key":53.65569068831377,"doc_count":17,"dc_power_agg":{"value":0.0}},{"key":56.249279017946265,"doc_count":17,"dc_power_agg":{"value":0.0}},{"key":58.63483107417463,"doc_count":17,"dc_power_agg":{"value":0.0}},{"key":60.835352658997266,"doc_count":17,"dc_power_agg":{"value":0.0}},{"key":62.87149505671871,"doc_count":17,"dc_power_agg":{"value":0.0}},{"key":64.76161651252164,"doc_count":17,"dc_power_agg":{"value":0.0}},{"key":66.52193854036197,"doc_count":17,"dc_power_agg":{"value":0.0}},{"key":68.16674119813763,"doc_count":17,"dc_power_agg":{"value":0.0}},{"key":69.70857084793244,"doc_count":17,"dc_power_agg":{"value":0.0}},{"key":71.15844512445423,"doc_count":17,"dc_power_agg":{"value":0.0}}]},"agg_conso":{"value":0.0}}}
CQL Driver integration
For better performances, you can use a CQL prepared statement to submit Elasticsearch queries as shown bellow in java. You can also retrieve the Elasticsearch results summary hits.total, hits.max_score, _shards.total, _shards.successful, _shards.skipped and _shards.failed from the result custom payload.
public static class IncomingPayload {
     public final long hitTotal;
     public final float hitMaxScore;
     public final int shardTotal;
     public final int shardSuccessful;
     public final int shardSkipped;
     public final int shardFailed;
     public IncomingPayload(Map<String,ByteBuffer> payload) {
         hitTotal = payload.get("hits.total").getLong();
         hitMaxScore = payload.get("hits.max_score").getFloat();
         shardTotal = payload.get("_shards.total").getInt();
         shardSuccessful = payload.get("_shards.successful").getInt();
         shardSkipped = payload.get("_shards.skipped").getInt();
         shardFailed = payload.get("_shards.failed").getInt();
     }
}

String esQuery = "{\"query\":{\"match_all\":{}}}";
ResultSet rs = session.execute("SELECT * FROM ks.table WHERE es_query=?", esQuery);
IncomingPayload payload = new IncomingPayload(rs.getExecutionInfo().getIncomingPayload());
System.out.println("hits.total="+payload.hitTotal);
Tip
When sum of _shards.successful, _shards.skipped and _shards.failed is lower than _shards.total, it means the search is not consistent because of missing nodes. In such cases, index state is red.
CQL Tracing
Elasticsearch search request may invlove CQL requests to requested fields from the underlying Cassandra table. When searching through CQL, you can use Cassandra tracing capabilities to troubleshoot Cassandra performance problems.
cassandra@cqlsh> tracing on;
Now Tracing is enabled
cassandra@cqlsh> SELECT * FROM twitter2.doc WHERE es_query='{"query":{"match_all":{}}}';

 _id | es_options | es_query | message                                          | post_date                           | price | user
-----+------------+----------+--------------------------------------------------+-------------------------------------+-------+------------
   2 |       null |     null | ['Elassandra adds dynamic mapping to Cassandra'] | ['2017-10-04 14:12:00.000000+0000'] |  [10] | ['Poulpy']
   3 |       null |     null | ['Elassandra adds dynamic mapping to Cassandra'] | ['2017-10-04 15:12:00.000000+0000'] |  [10] | ['Poulpy']
   5 |       null |     null | ['Elassandra adds dynamic mapping to Cassandra'] | ['2017-10-06 13:12:00.000000+0000'] |  [10] | ['Poulpy']
   8 |       null |     null | ['Elassandra adds dynamic mapping to Cassandra'] | ['2017-10-07 18:12:00.000000+0000'] |  [10] | ['Poulpy']
   1 |       null |     null | ['Elassandra adds dynamic mapping to Cassandra'] | ['2017-10-04 13:12:00.000000+0000'] |  [10] | ['Poulpy']
   4 |       null |     null | ['Elassandra adds dynamic mapping to Cassandra'] | ['2017-10-05 13:12:00.000000+0000'] |  [10] | ['Poulpy']
   6 |       null |     null | ['Elassandra adds dynamic mapping to Cassandra'] | ['2017-10-07 13:12:00.000000+0000'] |  [10] | ['Poulpy']
   7 |       null |     null | ['Elassandra adds dynamic mapping to Cassandra'] | ['2017-10-07 15:12:00.000000+0000'] |  [10] | ['Poulpy']

(8 rows)

Tracing session: 817762d0-c6d8-11e7-80c9-cf9ea31c7788

 activity                                                                                                           | timestamp                  | source    | source_elapsed | client
--------------------------------------------------------------------------------------------------------------------+----------------------------+-----------+----------------+-----------
                                                                                                Elasticsearch query | 2017-11-11 13:04:44.544000 | 127.0.0.1 |              0 | 127.0.0.1
      Parsing SELECT * FROM twitter2.doc WHERE es_query='{"query":{"match_all":{}}}'; [Native-Transport-Requests-1] | 2017-11-11 13:04:44.541000 | 127.0.0.1 |            192 | 127.0.0.1
                                                                  Preparing statement [Native-Transport-Requests-1] | 2017-11-11 13:04:44.541000 | 127.0.0.1 |            382 | 127.0.0.1
                                                            Executing single-partition query on roles [ReadStage-2] | 2017-11-11 13:04:44.542000 | 127.0.0.1 |           1048 | 127.0.0.1
                                                                         Acquiring sstable references [ReadStage-2] | 2017-11-11 13:04:44.542000 | 127.0.0.1 |           1145 | 127.0.0.1
                            Skipped 0/1 non-slice-intersecting sstables, included 0 due to tombstones [ReadStage-2] | 2017-11-11 13:04:44.542000 | 127.0.0.1 |           1327 | 127.0.0.1
                                                                          Key cache hit for sstable 1 [ReadStage-2] | 2017-11-11 13:04:44.542000 | 127.0.0.1 |           1475 | 127.0.0.1
                                                            Merged data from memtables and 1 sstables [ReadStage-2] | 2017-11-11 13:04:44.543000 | 127.0.0.1 |           1724 | 127.0.0.1
                                                                    Read 1 live and 0 tombstone cells [ReadStage-2] | 2017-11-11 13:04:44.543000 | 127.0.0.1 |           1830 | 127.0.0.1
                                                            Executing single-partition query on roles [ReadStage-4] | 2017-11-11 13:04:44.543000 | 127.0.0.1 |           2279 | 127.0.0.1
                                                                         Acquiring sstable references [ReadStage-4] | 2017-11-11 13:04:44.543000 | 127.0.0.1 |           2360 | 127.0.0.1
                            Skipped 0/1 non-slice-intersecting sstables, included 0 due to tombstones [ReadStage-4] | 2017-11-11 13:04:44.543000 | 127.0.0.1 |           2432 | 127.0.0.1
                                                                          Key cache hit for sstable 1 [ReadStage-4] | 2017-11-11 13:04:44.543000 | 127.0.0.1 |           2509 | 127.0.0.1
                                                            Merged data from memtables and 1 sstables [ReadStage-4] | 2017-11-11 13:04:44.544000 | 127.0.0.1 |           2736 | 127.0.0.1
                                                                    Read 1 live and 0 tombstone cells [ReadStage-4] | 2017-11-11 13:04:44.544000 | 127.0.0.1 |           2801 | 127.0.0.1
                                    Executing single-partition query on doc [elasticsearch[127.0.0.1][search][T#2]] | 2017-11-11 13:04:44.552000 | 127.0.0.1 |            143 | 127.0.0.1
                                               Acquiring sstable references [elasticsearch[127.0.0.1][search][T#2]] | 2017-11-11 13:04:44.552000 | 127.0.0.1 |            311 | 127.0.0.1
                                                Key cache hit for sstable 5 [elasticsearch[127.0.0.1][search][T#2]] | 2017-11-11 13:04:44.552000 | 127.0.0.1 |            438 | 127.0.0.1
                                                Key cache hit for sstable 6 [elasticsearch[127.0.0.1][search][T#2]] | 2017-11-11 13:04:44.553000 | 127.0.0.1 |            553 | 127.0.0.1
  Skipped 0/2 non-slice-intersecting sstables, included 0 due to tombstones [elasticsearch[127.0.0.1][search][T#2]] | 2017-11-11 13:04:44.553000 | 127.0.0.1 |            624 | 127.0.0.1
                                  Merged data from memtables and 2 sstables [elasticsearch[127.0.0.1][search][T#2]] | 2017-11-11 13:04:44.553000 | 127.0.0.1 |            953 | 127.0.0.1
                                          Read 1 live and 0 tombstone cells [elasticsearch[127.0.0.1][search][T#2]] | 2017-11-11 13:04:44.553000 | 127.0.0.1 |           1031 | 127.0.0.1
                                    Executing single-partition query on doc [elasticsearch[127.0.0.1][search][T#2]] | 2017-11-11 13:04:44.553000 | 127.0.0.1 |           1280 | 127.0.0.1
                                               Acquiring sstable references [elasticsearch[127.0.0.1][search][T#2]] | 2017-11-11 13:04:44.553000 | 127.0.0.1 |           1335 | 127.0.0.1
                                                Key cache hit for sstable 5 [elasticsearch[127.0.0.1][search][T#2]] | 2017-11-11 13:04:44.553001 | 127.0.0.1 |           1423 | 127.0.0.1
                                                Key cache hit for sstable 6 [elasticsearch[127.0.0.1][search][T#2]] | 2017-11-11 13:04:44.554000 | 127.0.0.1 |           1515 | 127.0.0.1
  Skipped 0/2 non-slice-intersecting sstables, included 0 due to tombstones [elasticsearch[127.0.0.1][search][T#2]] | 2017-11-11 13:04:44.554000 | 127.0.0.1 |           1593 | 127.0.0.1
                                  Merged data from memtables and 2 sstables [elasticsearch[127.0.0.1][search][T#2]] | 2017-11-11 13:04:44.554000 | 127.0.0.1 |           1853 | 127.0.0.1
                                          Read 1 live and 0 tombstone cells [elasticsearch[127.0.0.1][search][T#2]] | 2017-11-11 13:04:44.554000 | 127.0.0.1 |           1921 | 127.0.0.1
                                    Executing single-partition query on doc [elasticsearch[127.0.0.1][search][T#2]] | 2017-11-11 13:04:44.554000 | 127.0.0.1 |           2091 | 127.0.0.1
                                               Acquiring sstable references [elasticsearch[127.0.0.1][search][T#2]] | 2017-11-11 13:04:44.554000 | 127.0.0.1 |           2136 | 127.0.0.1
                                                Key cache hit for sstable 5 [elasticsearch[127.0.0.1][search][T#2]] | 2017-11-11 13:04:44.554001 | 127.0.0.1 |           2253 | 127.0.0.1
                                                Key cache hit for sstable 6 [elasticsearch[127.0.0.1][search][T#2]] | 2017-11-11 13:04:44.554001 | 127.0.0.1 |           2346 | 127.0.0.1
  Skipped 0/2 non-slice-intersecting sstables, included 0 due to tombstones [elasticsearch[127.0.0.1][search][T#2]] | 2017-11-11 13:04:44.554001 | 127.0.0.1 |           2408 | 127.0.0.1
                                  Merged data from memtables and 2 sstables [elasticsearch[127.0.0.1][search][T#2]] | 2017-11-11 13:04:44.555000 | 127.0.0.1 |           2654 | 127.0.0.1
                                   Executing single-partition query on doc [elasticsearch[127.0.0.2][search][T#10]] | 2017-11-11 13:04:44.555000 | 127.0.0.2 |            116 | 127.0.0.1
                                          Read 1 live and 0 tombstone cells [elasticsearch[127.0.0.1][search][T#2]] | 2017-11-11 13:04:44.555000 | 127.0.0.1 |           2733 | 127.0.0.1
                                              Acquiring sstable references [elasticsearch[127.0.0.2][search][T#10]] | 2017-11-11 13:04:44.555000 | 127.0.0.2 |            303 | 127.0.0.1
                                    Executing single-partition query on doc [elasticsearch[127.0.0.1][search][T#2]] | 2017-11-11 13:04:44.555000 | 127.0.0.1 |           2950 | 127.0.0.1
                                               Acquiring sstable references [elasticsearch[127.0.0.1][search][T#2]] | 2017-11-11 13:04:44.555000 | 127.0.0.1 |           3002 | 127.0.0.1
                                                Key cache hit for sstable 5 [elasticsearch[127.0.0.1][search][T#2]] | 2017-11-11 13:04:44.555000 | 127.0.0.1 |           3095 | 127.0.0.1
                                                Key cache hit for sstable 6 [elasticsearch[127.0.0.1][search][T#2]] | 2017-11-11 13:04:44.555000 | 127.0.0.1 |           3191 | 127.0.0.1
  Skipped 0/2 non-slice-intersecting sstables, included 0 due to tombstones [elasticsearch[127.0.0.1][search][T#2]] | 2017-11-11 13:04:44.555001 | 127.0.0.1 |           3253 | 127.0.0.1
                                  Merged data from memtables and 2 sstables [elasticsearch[127.0.0.1][search][T#2]] | 2017-11-11 13:04:44.556000 | 127.0.0.1 |           3549 | 127.0.0.1
                                               Key cache hit for sstable 5 [elasticsearch[127.0.0.2][search][T#10]] | 2017-11-11 13:04:44.556000 | 127.0.0.2 |            480 | 127.0.0.1
                                          Read 1 live and 0 tombstone cells [elasticsearch[127.0.0.1][search][T#2]] | 2017-11-11 13:04:44.556000 | 127.0.0.1 |           3656 | 127.0.0.1
                                               Key cache hit for sstable 6 [elasticsearch[127.0.0.2][search][T#10]] | 2017-11-11 13:04:44.556000 | 127.0.0.2 |            650 | 127.0.0.1
 Skipped 0/2 non-slice-intersecting sstables, included 0 due to tombstones [elasticsearch[127.0.0.2][search][T#10]] | 2017-11-11 13:04:44.556000 | 127.0.0.2 |            747 | 127.0.0.1
                                 Merged data from memtables and 2 sstables [elasticsearch[127.0.0.2][search][T#10]] | 2017-11-11 13:04:44.556000 | 127.0.0.2 |           1245 | 127.0.0.1
                                         Read 1 live and 0 tombstone cells [elasticsearch[127.0.0.2][search][T#10]] | 2017-11-11 13:04:44.556000 | 127.0.0.2 |           1362 | 127.0.0.1
                                                                                                   Request complete | 2017-11-11 13:04:44.563745 | 127.0.0.1 |          19745 | 127.0.0.1
You can then retreive tracing information stored in the system_traces keyspace for 24 hours like this.
cassandra@cqlsh> select * from system_traces.sessions;

 session_id                           | client    | command | coordinator | duration | parameters                                                                                                                                                                   | request             | started_at
--------------------------------------+-----------+---------+-------------+----------+------------------------------------------------------------------------------------------------------------------------------------------------------------------------------+---------------------+---------------------------------
 817762d0-c6d8-11e7-80c9-cf9ea31c7788 | 127.0.0.1 |   QUERY |   127.0.0.1 |    19745 | {'consistency_level': 'ONE', 'page_size': '100', 'query': 'SELECT * FROM twitter2.doc WHERE es_query=''{"query":{"match_all":{}}}'';', 'serial_consistency_level': 'SERIAL'} | Elasticsearch query | 2017-11-11 12:04:44.544000+0000
 7c49dae0-c6d8-11e7-80c9-cf9ea31c7788 | 127.0.0.1 |   QUERY |   127.0.0.1 |    20002 | {'consistency_level': 'ONE', 'page_size': '100', 'query': 'SELECT * FROM twitter2.doc WHERE es_query=''{"query":{"match_all":{}}}'';', 'serial_consistency_level': 'SERIAL'} | Elasticsearch query | 2017-11-11 12:04:35.856000+0000
 6786c2d0-c6d8-11e7-80c9-cf9ea31c7788 | 127.0.0.1 |   QUERY |   127.0.0.1 |    16426 |                                              {'consistency_level': 'ONE', 'page_size': '100', 'query': 'SELECT * FROM twitter2.doc ;', 'serial_consistency_level': 'SERIAL'} |  Execute CQL3 query | 2017-11-11 12:04:01.021000+0000
 6b49e550-c6d8-11e7-80c9-cf9ea31c7788 | 127.0.0.1 |   QUERY |   127.0.0.1 |    14129 |                                               {'consistency_level': 'ONE', 'page_size': '100', 'query': 'SELECT * FROM twitter2.doc;', 'serial_consistency_level': 'SERIAL'} |  Execute CQL3 query | 2017-11-11 12:04:07.333000+0000

(4 rows)
cassandra@cqlsh> SHOW SESSION 817762d0-c6d8-11e7-80c9-cf9ea31c7788;

Tracing session: 817762d0-c6d8-11e7-80c9-cf9ea31c7788

 activity                                                                                                           | timestamp                  | source    | source_elapsed | client
--------------------------------------------------------------------------------------------------------------------+----------------------------+-----------+----------------+-----------
                                                                                                Elasticsearch query | 2017-11-11 13:04:44.544000 | 127.0.0.1 |              0 | 127.0.0.1
      Parsing SELECT * FROM twitter2.doc WHERE es_query='{"query":{"match_all":{}}}'; [Native-Transport-Requests-1] | 2017-11-11 13:04:44.541000 | 127.0.0.1 |            192 | 127.0.0.1
                                                                  Preparing statement [Native-Transport-Requests-1] | 2017-11-11 13:04:44.541000 | 127.0.0.1 |            382 | 127.0.0.1
                                                            Executing single-partition query on roles [ReadStage-2] | 2017-11-11 13:04:44.542000 | 127.0.0.1 |           1048 | 127.0.0.1
                                                                         Acquiring sstable references [ReadStage-2] | 2017-11-11 13:04:44.542000 | 127.0.0.1 |           1145 | 127.0.0.1
                            Skipped 0/1 non-slice-intersecting sstables, included 0 due to tombstones [ReadStage-2] | 2017-11-11 13:04:44.542000 | 127.0.0.1 |           1327 | 127.0.0.1
                                                                          Key cache hit for sstable 1 [ReadStage-2] | 2017-11-11 13:04:44.542000 | 127.0.0.1 |           1475 | 127.0.0.1
                                                            Merged data from memtables and 1 sstables [ReadStage-2] | 2017-11-11 13:04:44.543000 | 127.0.0.1 |           1724 | 127.0.0.1
                                                                    Read 1 live and 0 tombstone cells [ReadStage-2] | 2017-11-11 13:04:44.543000 | 127.0.0.1 |           1830 | 127.0.0.1
                                                            Executing single-partition query on roles [ReadStage-4] | 2017-11-11 13:04:44.543000 | 127.0.0.1 |           2279 | 127.0.0.1
                                                                         Acquiring sstable references [ReadStage-4] | 2017-11-11 13:04:44.543000 | 127.0.0.1 |           2360 | 127.0.0.1
                            Skipped 0/1 non-slice-intersecting sstables, included 0 due to tombstones [ReadStage-4] | 2017-11-11 13:04:44.543000 | 127.0.0.1 |           2432 | 127.0.0.1
                                                                          Key cache hit for sstable 1 [ReadStage-4] | 2017-11-11 13:04:44.543000 | 127.0.0.1 |           2509 | 127.0.0.1
                                                            Merged data from memtables and 1 sstables [ReadStage-4] | 2017-11-11 13:04:44.544000 | 127.0.0.1 |           2736 | 127.0.0.1
                                                                    Read 1 live and 0 tombstone cells [ReadStage-4] | 2017-11-11 13:04:44.544000 | 127.0.0.1 |           2801 | 127.0.0.1
                                    Executing single-partition query on doc [elasticsearch[127.0.0.1][search][T#2]] | 2017-11-11 13:04:44.552000 | 127.0.0.1 |            143 | 127.0.0.1
                                               Acquiring sstable references [elasticsearch[127.0.0.1][search][T#2]] | 2017-11-11 13:04:44.552000 | 127.0.0.1 |            311 | 127.0.0.1
                                                Key cache hit for sstable 5 [elasticsearch[127.0.0.1][search][T#2]] | 2017-11-11 13:04:44.552000 | 127.0.0.1 |            438 | 127.0.0.1
                                                Key cache hit for sstable 6 [elasticsearch[127.0.0.1][search][T#2]] | 2017-11-11 13:04:44.553000 | 127.0.0.1 |            553 | 127.0.0.1
  Skipped 0/2 non-slice-intersecting sstables, included 0 due to tombstones [elasticsearch[127.0.0.1][search][T#2]] | 2017-11-11 13:04:44.553000 | 127.0.0.1 |            624 | 127.0.0.1
                                  Merged data from memtables and 2 sstables [elasticsearch[127.0.0.1][search][T#2]] | 2017-11-11 13:04:44.553000 | 127.0.0.1 |            953 | 127.0.0.1
                                          Read 1 live and 0 tombstone cells [elasticsearch[127.0.0.1][search][T#2]] | 2017-11-11 13:04:44.553000 | 127.0.0.1 |           1031 | 127.0.0.1
                                    Executing single-partition query on doc [elasticsearch[127.0.0.1][search][T#2]] | 2017-11-11 13:04:44.553000 | 127.0.0.1 |           1280 | 127.0.0.1
                                               Acquiring sstable references [elasticsearch[127.0.0.1][search][T#2]] | 2017-11-11 13:04:44.553000 | 127.0.0.1 |           1335 | 127.0.0.1
                                                Key cache hit for sstable 5 [elasticsearch[127.0.0.1][search][T#2]] | 2017-11-11 13:04:44.553001 | 127.0.0.1 |           1423 | 127.0.0.1
                                                Key cache hit for sstable 6 [elasticsearch[127.0.0.1][search][T#2]] | 2017-11-11 13:04:44.554000 | 127.0.0.1 |           1515 | 127.0.0.1
  Skipped 0/2 non-slice-intersecting sstables, included 0 due to tombstones [elasticsearch[127.0.0.1][search][T#2]] | 2017-11-11 13:04:44.554000 | 127.0.0.1 |           1593 | 127.0.0.1
                                  Merged data from memtables and 2 sstables [elasticsearch[127.0.0.1][search][T#2]] | 2017-11-11 13:04:44.554000 | 127.0.0.1 |           1853 | 127.0.0.1
                                          Read 1 live and 0 tombstone cells [elasticsearch[127.0.0.1][search][T#2]] | 2017-11-11 13:04:44.554000 | 127.0.0.1 |           1921 | 127.0.0.1
                                    Executing single-partition query on doc [elasticsearch[127.0.0.1][search][T#2]] | 2017-11-11 13:04:44.554000 | 127.0.0.1 |           2091 | 127.0.0.1
                                               Acquiring sstable references [elasticsearch[127.0.0.1][search][T#2]] | 2017-11-11 13:04:44.554000 | 127.0.0.1 |           2136 | 127.0.0.1
                                                Key cache hit for sstable 5 [elasticsearch[127.0.0.1][search][T#2]] | 2017-11-11 13:04:44.554001 | 127.0.0.1 |           2253 | 127.0.0.1
                                                Key cache hit for sstable 6 [elasticsearch[127.0.0.1][search][T#2]] | 2017-11-11 13:04:44.554001 | 127.0.0.1 |           2346 | 127.0.0.1
  Skipped 0/2 non-slice-intersecting sstables, included 0 due to tombstones [elasticsearch[127.0.0.1][search][T#2]] | 2017-11-11 13:04:44.554001 | 127.0.0.1 |           2408 | 127.0.0.1
                                  Merged data from memtables and 2 sstables [elasticsearch[127.0.0.1][search][T#2]] | 2017-11-11 13:04:44.555000 | 127.0.0.1 |           2654 | 127.0.0.1
                                   Executing single-partition query on doc [elasticsearch[127.0.0.2][search][T#10]] | 2017-11-11 13:04:44.555000 | 127.0.0.2 |            116 | 127.0.0.1
                                          Read 1 live and 0 tombstone cells [elasticsearch[127.0.0.1][search][T#2]] | 2017-11-11 13:04:44.555000 | 127.0.0.1 |           2733 | 127.0.0.1
                                              Acquiring sstable references [elasticsearch[127.0.0.2][search][T#10]] | 2017-11-11 13:04:44.555000 | 127.0.0.2 |            303 | 127.0.0.1
                                    Executing single-partition query on doc [elasticsearch[127.0.0.1][search][T#2]] | 2017-11-11 13:04:44.555000 | 127.0.0.1 |           2950 | 127.0.0.1
                                               Acquiring sstable references [elasticsearch[127.0.0.1][search][T#2]] | 2017-11-11 13:04:44.555000 | 127.0.0.1 |           3002 | 127.0.0.1
                                                Key cache hit for sstable 5 [elasticsearch[127.0.0.1][search][T#2]] | 2017-11-11 13:04:44.555000 | 127.0.0.1 |           3095 | 127.0.0.1
                                                Key cache hit for sstable 6 [elasticsearch[127.0.0.1][search][T#2]] | 2017-11-11 13:04:44.555000 | 127.0.0.1 |           3191 | 127.0.0.1
  Skipped 0/2 non-slice-intersecting sstables, included 0 due to tombstones [elasticsearch[127.0.0.1][search][T#2]] | 2017-11-11 13:04:44.555001 | 127.0.0.1 |           3253 | 127.0.0.1
                                  Merged data from memtables and 2 sstables [elasticsearch[127.0.0.1][search][T#2]] | 2017-11-11 13:04:44.556000 | 127.0.0.1 |           3549 | 127.0.0.1
                                               Key cache hit for sstable 5 [elasticsearch[127.0.0.2][search][T#10]] | 2017-11-11 13:04:44.556000 | 127.0.0.2 |            480 | 127.0.0.1
                                          Read 1 live and 0 tombstone cells [elasticsearch[127.0.0.1][search][T#2]] | 2017-11-11 13:04:44.556000 | 127.0.0.1 |           3656 | 127.0.0.1
                                               Key cache hit for sstable 6 [elasticsearch[127.0.0.2][search][T#10]] | 2017-11-11 13:04:44.556000 | 127.0.0.2 |            650 | 127.0.0.1
 Skipped 0/2 non-slice-intersecting sstables, included 0 due to tombstones [elasticsearch[127.0.0.2][search][T#10]] | 2017-11-11 13:04:44.556000 | 127.0.0.2 |            747 | 127.0.0.1
                                 Merged data from memtables and 2 sstables [elasticsearch[127.0.0.2][search][T#10]] | 2017-11-11 13:04:44.556000 | 127.0.0.2 |           1245 | 127.0.0.1
                                         Read 1 live and 0 tombstone cells [elasticsearch[127.0.0.2][search][T#10]] | 2017-11-11 13:04:44.556000 | 127.0.0.2 |           1362 | 127.0.0.1
                                                                                                   Request complete | 2017-11-11 13:04:44.563745 | 127.0.0.1 |          19745 | 127.0.0.1
JMX Managment & Monitoring
The JMX technology provides a standard solution for managing and monitoring java applications. With the JMX feature, you can manage and monitor both Cassandra and Elasticsearch.
JMX Monitoring
The JMX feature expose Elasticsearch metrcis over JMX, allowing to monitor Elasticsearch cluster, index shards, threadpool and networks activities. You can browse these metrics with various JMX clients like VisualVM or jmxterm.
JMXTerm example :
java -jar jmxterm-1.0.0-uber.jar -l localhost:7199
$>domain org.elasticsearch.index
#domain is set to org.elasticsearch.index
$>bean org.elasticsearch.index:name=sales_2017,scope=search,type=IndexShard
#bean is set to org.elasticsearch.index:name=sales_2017,scope=search,type=IndexShard
$>get *
#mbean = org.elasticsearch.index:name=sales_2017,scope=search,type=IndexShard:
QueryTotal = 21;
FetchTotal = 0;
ScrollTotal = 0;
QueryTimeInMillis = 56038;
QueryCurrent = 0;
FetchTimeInMillis = 0;
FetchCurrent = 0;
ScrollTimeInMillis = 0;
ScrollCurrent = 0;
SuggestCount = 0;
SuggestTimeInMillis = 0;
SuggestCurrent = 0;
$>
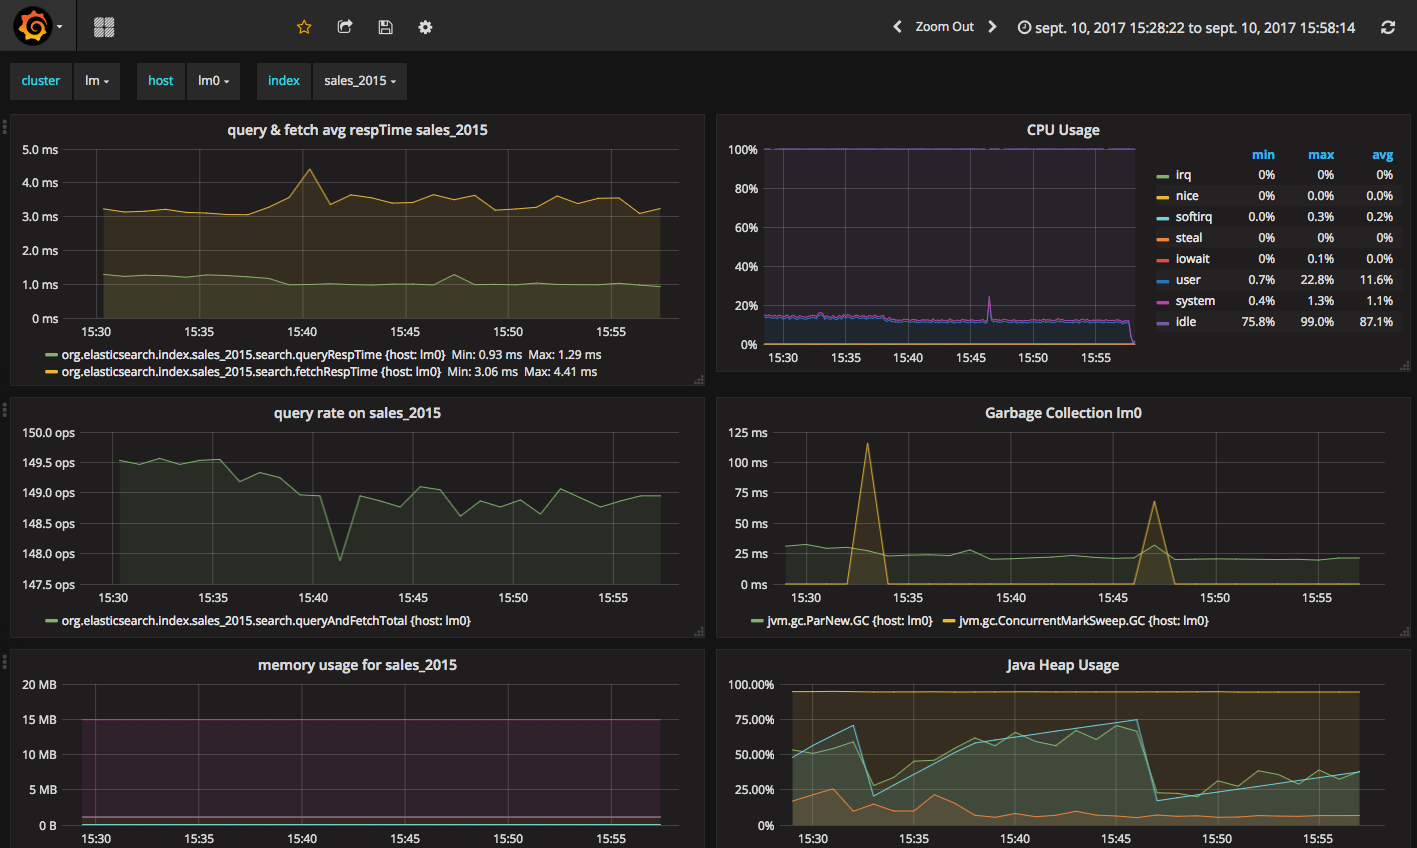
These metrcis can be pulled, or pushed to various tools (graphite, ganglia or influxdb) using the popular Metrics Library embedded in Apache Cassandra.
Here is a sample configuration located in conf/influxdb-reporting.yaml sending JMX metrics to an influxdb database named elassandra.
influxdb:
-
  dbName: 'elassandra'
  protocol: 'http'
  tags:
    environment: 'test'
    cluster: 'test_cluster'
    host: 'vm1'
  hosts:
    - host: 'vm1'
      port: 8086
  timeunit: 'SECONDS'
  period: 60
  prefix: ''
  groupGauges: true
To enable this configuration, add JVM_OPTS=”$JVM_OPTS -Dcassandra.metricsReporterConfigFile=influxdb-reporting.yaml” in your conf/cassandra-env.sh
Note
When installing the Elassandra Enterprise plugin, the following jar files are added to the cassandra classpath :
Then configure Grafana to build your Elassandra dashboard.
Enable/Disable search on a node
The JMX feature allows to exclude/include a node from distributed search while still receiving CQL write, repairing or rebuilding its elasticsearch indices, by
setting the following attributes on the JMX Bean org.elasticsearch.node:type=node
| JMX Attribute | Default value | Description |
|---|---|---|
SearchEnabled |
true | Set wether or not the node is invloved in distributed search queries from other nodes.
When SearchEnabled is false on a node, all its shards are seen UNASSIGNED from other nodes. |
AutoEnableSearch |
true | If true, the node automatically set SearchEnabled to true when it becomes available,
participating to distributed search queries. In order to restart a node in a maintenance mode for search
requests, you can set AutoEnableSearch to false with the system property es.auto_enable_search. |
To set SearchEnabled on command line, just use jmxterm as in the following exemple.
echo "set -b org.elasticsearch.node:type=node SearchEnabled false" | java -jar jmxterm-1.0.0-uber.jar -l localhost:7199
SSL Network Encryption
The SSL Feature provides trafic encryption for both HTTP and Elasticsearch transport connections.
Note
Elasticsearch transport protocol is the native binary protocol used for Elasticsearch node-to-node communication. You can also use the transport protocol from a client application written in java, as describe in the elasticsearch documentation.
SSL configuration is defined in your conf/cassandra.yaml for both Cassandra and Elasticsearch :
- Server options defines node-to-node encryption for both Cassandra and Elasticsearch. Obviously, Elasticsearch transport connections are encrypted when internode_encryption is set to all or rack (there is no elasticsearch cross-datacenter traffic).
- Client options defines client-to-node encryption to request both Cassandra and Elasticsearch. If optional is true, Elasticsearch still accepts clear connections for HTTP and transport request.
To ensure support for all encryption algorithms, it is highly recommended to install the JCE Unlimited Strength Jurisdiction policy files on all nodes.
Here an SSL configuration in your conf/cassandra.yaml file :
# Enable or disable inter-node encryption
# Default settings are TLS v1, RSA 1024-bit keys (it is imperative that
# users generate their own keys) TLS_RSA_WITH_AES_128_CBC_SHA as the cipher
# suite for authentication, key exchange and encryption of the actual data transfers.
# Use the DHE/ECDHE ciphers if running in FIPS 140 compliant mode.
# NOTE: No custom encryption options are enabled at the moment
# The available internode options are : all, none, dc, rack
#
# If set to dc cassandra will encrypt the traffic between the DCs
# If set to rack cassandra will encrypt the traffic between the racks
#
# The passwords used in these options must match the passwords used when generating
# the keystore and truststore.  For instructions on generating these files, see:
# http://download.oracle.com/javase/6/docs/technotes/guides/security/jsse/JSSERefGuide.html#CreateKeystore
#
server_encryption_options:
    internode_encryption: all
    keystore: conf/.keystore.jks
    keystore_password: changeit
    truststore: conf/.truststore.jks
    truststore_password: changeit
    # More advanced defaults below:
    protocol: TLSv1.2
    # algorithm: SunX509
    # store_type: JKS
    # cipher_suites: [TLS_RSA_WITH_AES_128_CBC_SHA,TLS_RSA_WITH_AES_256_CBC_SHA,TLS_DHE_RSA_WITH_AES_128_CBC_SHA,TLS_DHE_RSA_WITH_AES_256_CBC_SHA,TLS_ECDHE_RSA_WITH_AES_128_CBC_SHA,TLS_ECDHE_RSA_WITH_AES_256_CBC_SHA]
    # require_client_auth: true

# enable or disable client/server encryption.
client_encryption_options:
    enabled: true
    # If enabled and optional is set to true encrypted and unencrypted connections are handled.
    optional: true
    keystore: conf/.keystore.jks
    keystore_password: changeit
    require_client_auth: true
    # Set trustore and truststore_password if require_client_auth is true
    truststore: conf/.truststore.jks
    truststore_password: changeit
    # More advanced defaults below:
    protocol: TLSv1.2
    # algorithm: SunX509
    # store_type: JKS
    # cipher_suites: [TLS_RSA_WITH_AES_128_CBC_SHA,TLS_RSA_WITH_AES_256_CBC_SHA,TLS_DHE_RSA_WITH_AES_128_CBC_SHA,TLS_DHE_RSA_WITH_AES_256_CBC_SHA,TLS_ECDHE_RSA_WITH_AES_128_CBC_SHA,TLS_ECDHE_RSA_WITH_AES_256_CBC_SHA]
Caution
If paths to keystores are relative, you could faced an issue when starting elassandra from another directory than the install directory. You should use absolute keystore paths to avoid such issues.
Elasticsearch SSL configuration
SSL for Elasticsearch is actived according to the following settings in your conf/elasticsearch.yml :
| Setting | Default | Description |
|---|---|---|
https.enabled |
false | Enable HTTPS on client-to-node Elasticsearch connections |
ssl.transport.enabled |
false | Enable SSL on Elastisearch transport connections (node-to-node connections) |
Once HTTPS is enabled, accessing your elasticsearch cluster requires the HTTPS protocol and a trusted certificate to validate the server side certificate :
curl -XGET --cacert conf/cacert.pem "https://localhost:9200/my_index/_search"
You can also check your SSL configuration with a GET /_sslinfo request.
curl -XGET --cacert conf/cacert.pem "https://localhost:9200/_sslinfo"
{
   "https_protocol" : "TLSv1.2",
   "https_cipher" : "TLS_ECDHE_RSA_WITH_AES_256_GCM_SHA384"
}
If client encryption is enabled in your conf/cassandra.yaml, and require_client_auth=true, a client certificate is required to connect.
JMX traffic Encryption
Enable SSL for JMX by setting the following parameters.
JVM_OPTS="$JVM_OPTS -Dcom.sun.management.jmxremote.ssl=true"
JVM_OPTS="$JVM_OPTS -Dcom.sun.management.jmxremote.ssl.need.client.auth=true"
JVM_OPTS="$JVM_OPTS -Dcom.sun.management.jmxremote.registry.ssl=true"
#JVM_OPTS="$JVM_OPTS -Dcom.sun.management.jmxremote.ssl.enabled.protocols=<enabled-protocols>"
#JVM_OPTS="$JVM_OPTS -Dcom.sun.management.jmxremote.ssl.enabled.cipher.suites=<enabled-cipher-suites>"

JVM_OPTS="$JVM_OPTS -Djavax.net.ssl.keyStore=<install_dir>/conf/server-keystore.jks"
JVM_OPTS="$JVM_OPTS -Djavax.net.ssl.keyStorePassword=changeit"
JVM_OPTS="$JVM_OPTS -Djavax.net.ssl.trustStore=<install_dir>/cassandra/conf/server-truststore.jks"
JVM_OPTS="$JVM_OPTS -Djavax.net.ssl.trustStorePassword=changeit"
Once SSL is enabled on JMX, nodetool utility requires the –ssl option.
Authentication and Authorization
Elasticsearch authentifcation and autorization is based on Cassandra internal Authentication and Role-Based Access Control, allowing to get an homogeneous security policy.
Cassandra internal authentication
To enable Cassandra authentication, set the following settings in your conf/cassandra.yaml, and restart your node :
authenticator: PasswordAuthenticator
authorizer: CassandraAuthorizer
Once authentication is enabled, create a new Cassandra superuser to avoid issue with the default “cassandra” superuser (Authentication with the cassandra superuser require QUORUM nodes to be available in your cluster), and change the default cassandra password.
CREATE ROLE admin WITH PASSWORD='******' AND LOGIN=true AND SUPERUSER=true;
ALTER ROLE cassandra WITH PASSWORD='******';
Then configure the replication factor for the system_auth keyspace according to your cluster configuration (see Configure Native Authentication). Finally, adjust roles and credential cache settings and disable JMX configuration of authentifcation and authorization cache.
Elasticsearch Authentication, Authorization and Content-Based Security
Elasticsearch authentication settings are defined in conf/elasticsearch.yml. To be effective, these settings must be the same on all nodes of a Cassandra datacenter.
| Setting | Default | Description |
|---|---|---|
aaa.enabled |
false | Enable Elasticsearch authentication and authorization. |
aaa.rest.prompt |
true | By default, a rejected HTTP request returns with a 403 code, meaning access is forbidden. When prompt is configured, rejected anonymous HTTP requests return a code 401 this prompt in the authorization header. |
aaa.rest.realm |
${cluster_name} authentication required | Prompted realm when HTTP authentifcation is required. |
aaa.user_header |
When user is already authenticated by an HTTP proxy, you can define the HTTP header name used to carry the cassandra user’s name used to execute an elasticsearch request. To avoid security breach, you should properly restric unauthenticated access to elassandra when using such mecanism. | |
aaa.anonymous_user |
Defines the cassandra user’s name used to execute unauthenticated request. If undefined, unauthenticated requests are rejected. | |
aaa.shared_secret |
Base64 encoded cluster name | Shared secret used to tag authorized requests on the coordinator node. This should be a confidential per datacenter secret. |
cbs.enabled |
false | Enable or disable Content-Based Security. |
Tip
Elasticsearch user authentication requires HTTPS. (User authentication without HTTPS is not supported).
In order to grant an Elasticsearch request, Elassandra checks two levels of access rights :
- First, Elassandra looks up for a privilege matching your elasticsearch request in the Cassandra table
elastic_admin.privileges. - If no privilege matches and request is related to indices, Elassandra looks up for a Cassandra permission associated to the user’s roles.
Privileges
Privileges are defined in the Cassandra table elastic_admin.privileges.
CREATE TABLE elastic_admin.privileges (
   role text,
   actions text,
   indices text,
   fields set<text>,
   query text,
   PRIMARY KEY (role, actions, indices)
);
role: The user’s role.actions: Regular expression defining the authorized actions.indices: Regular expression defining the authorized target indices. If null, all indices backed by keyspaces associated to the role.fields: List of visible fields of documents when Content-Base Security is enabled. Supports wilcards, for exemple foo* will match all fields starting by foo. If your request matches multiple privileges, returned document may contains all associated fields.query: Filter query when Content-Base Security is enabled. If your request matches multiple privileges, returned document are filtered with all queries.
Important
- Cassandra roles with superuser = true have full access to Elasticsearch.
- All cluster-level access should be granted using privileges.
- Content-Based Security should be used with read-only accounts.
Permissions
Cassandra permission associated to a role are granted or revoked as shown below :
GRANT SELECT ON KEYSPACE sales TO sales;
LIST ALL PERMISSIONS;

 role      | username  | resource         | permission
-----------+-----------+------------------+------------
 cassandra | cassandra |     <role sales> |      ALTER
 cassandra | cassandra |     <role sales> |       DROP
 cassandra | cassandra |     <role sales> |  AUTHORIZE
    sales |      sales | <keyspace sales> |     MODIFY

(4 rows)

cassandra@cqlsh> REVOKE SELECT ON KEYSPACE sales FROM sales;
Cassandra permissions associated to a role are mapped to Elasticserach Document and Indices APIs as follow.
| Cassandra privilege | Cassandra Permissions | Elasticsearch Action | Elasticsearch API |
|---|---|---|---|
| CREATE | CREATE KEYSPACE and CREATE TABLE in any keyspace. | indices:admin/create | Create Index |
| ALTER | ALTER KEYSPACE and ALTER TABLE in any keyspace. | indices:admin/mapping indices:admin/alias indices:admin/template indices:admin/settings/update | Put Mapping Index Alias Index Templates Update Indices Settings |
| DROP | DROP KEYSPACE and DROP TABLE in any keyspace. | indices:admin/delete | Delete Index |
| EXECUTE | Execute operations on any elasticsearch indices associated to the granted keyspaces. | indices:admin/refresh indices:admin/flush indices:admin/optimize indices:admin/open indices:admin/close indices:admin/cache/clear indices:admin/analyze | Refresh Flush Force Merge Open Index Close Index Clear Cache Analyze |
| DESCRIBE | Retrieve stats about elasticsearch indices associated to the granted mbeans. | indices:monitor/stats indices:monitor/segments | Indices Stats Indices Segments |
| SELECT | SELECT on any table. | indices:data/read/.* indices:admin/get indices:admin/exists indices:admin/types/exists indices:admin/mapping indices:admin/mappings/fields/get | All document reading API Get Index Indices Exists Type Exists Get Mapping Get Field Mapping |
| MODIFY | INSERT, UPDATE, DELETE on any table. | indices:data/write/.* | All document writing API |
Privilege caching
For performance reasons, the elasticsearch privilege table is cached into memory, according the the following settings in conf/elasticsearch.yml :
| Setting | Default | Description |
|---|---|---|
aaa.privilege_cache_expire |
1h | Privlege cache entry TTL |
aaa.privilege_cache_size |
1024 | Privilege cache max entries. |
When changing a privilege in elastic_admin.privileges, you should clear the cache with the follwing REST request to put the change into effect on available nodes :
curl -XPOST --user admin:admin --cacert conf/cacert.pem "https://localhost:9200/_aaa_clear_privilege_cache?pretty"
{
  "_nodes" : {
    "total" : 2,
    "successful" : 2,
    "failed" : 0
  },
  "cluster_name" : "TestCluster",
  "nodes" : {
    "d607917d-8c68-4cc5-8dc2-2aa21f5ea986" : {
      "name" : "127.0.0.2"
    },
    "a1c5307c-5f5a-4676-a6f0-50f221dd655b" : {
      "name" : "127.0.0.1"
    }
  }
}
If you just want to invalidate the privilege cache for some roles, you can specify roles :
POST _aaa_clear_privilege_cache?pretty&roles=sales,kibana"
Tip
If you are running multiple Elasticsearch cluster in your Cassandra cluster, you should clear privilege cache on each datacenter where Elasticsearch is enabled.
Integration
Secured Transport Client
The elasticsearch transport protocol used for inter-node communication can be used directly from your java application. It is very efficient as it does not have to deal with JSON serialzation. Strapdata provides a SSL transport client to work with a secured Elassandra cluster :
- If your Elassandra cluster requires user authentification, check that your user have access to the cluster topology with the Nodes Info API (action cluster:monitor/nodes/info).
- Add the ssl-transport-client.jar and its dependencies in your CLASSPATH.
- Add the desired configuration to your client settings, including SSL settings as shown in the following exemple.
- Add an
ssl.transport_client_credentialcontaining username:password to monitor the cluster state. This account must be authorized to docluster:monitor/stateandcluster:monitor/nodes/livenessin theelastic_admin.privilegestable.
CREATE ROLE monitor WITH PASSWORD = 'monitor' AND LOGIN = true;
INSERT INTO elastic_admin.privileges (role, actions,indices) VALUES('monitor','cluster:monitor/state','.*');
INSERT INTO elastic_admin.privileges (role, actions,indices) VALUES('monitor','cluster:monitor/nodes/liveness','.*');
#. Add an Authorization header to your client containing your based-64 encoded login and password. This account must have
appropriate Cassandra permissions or privileges in the elastic_admin.privileges table.
...
import com.strapdata.elasticsearch.plugins.ssl.PreBuiltSslTransportClient;

TransportClient client = new PreBuiltSslTransportClient(Settings.builder()
     .put("cluster.name", "myClusterName")
     .put("client.transport.sniff",true)
     .put("ssl.transport.enabled", true)
     .put("ssl.truststore.path", "/path/to/truststore.jks")
     .put("ssl.truststore.password", "******")
     .put("ssl.transport_client_credential", "monitor:password")   // Add credential to monitor Elasticsearch
     ...
     .build())
 .addTransportAddress(new InetSocketTransportAddress(InetAddress.getByName("localhost"), 9300))

 // Add user credential to request elasticsearch
 client.filterWithHeader(Collections.singletonMap("Authorization", PreBuiltSslTransportClient.encodeBasicHeader("bob","password")));
Available security settings for the secured transport client for Elassandra :
| Setting | Default | Description |
|---|---|---|
| ssl.transport.enabled | false | Enable SSL on transport connections. |
| ssl.algorithm | SunX509 | Algorithm used to manage keys and certificates. |
| ssl.storetype | JKS | Crytptographic stores file format. |
| ssl.trust_all_cert | false | Trust all certificates |
| ssl.truststore.path | conf/.truststore | Path to your truststore. |
| ssl.truststore.password | cassandra | Truststore password. |
| ssl.protocol | TLSv1.2 | Secure protocol. |
| ssl.ciphers | JCE default | SSL Cipher suite |
| ssl.require_client_auth | false | Enable SSL client authentication. |
| ssl.keystore.path | conf/.truststore | Path to your keystore when using SSL client authentication. |
| ssl.keystore.password | cassandra | Truststore password when using SSL client authentication. |
| ssl.require_endpoint_verification | false | Enable server hostname verification. |
| ssl.transport_client_credential | login:password used to monitor the Elasticsearch cluster state. |
Multi-user Kibana configuration
Kibana needs a dedicated kibana account to manage kibana configuration, with the CREATE, ALTER, MODIFY, SELECT cassandra permissions.
CREATE ROLE kibana WITH PASSWORD = '*****' AND LOGIN = true;
CREATE KEYSPACE "_kibana" WITH replication = {'class': 'NetworkTopologyStrategy', 'DC1':'1'};
GRANT CREATE ON KEYSPACE "_kibana" TO kibana;
GRANT ALTER ON KEYSPACE "_kibana" TO kibana;
GRANT SELECT ON KEYSPACE "_kibana" TO kibana;
GRANT MODIFY ON KEYSPACE "_kibana" TO kibana;
LIST ALL PERMISSIONS OF kibana;

 role   | username | resource           | permission
--------+----------+--------------------+------------
 kibana |   kibana | <keyspace _kibana> |     CREATE
 kibana |   kibana | <keyspace _kibana> |      ALTER
 kibana |   kibana | <keyspace _kibana> |     SELECT
 kibana |   kibana | <keyspace _kibana> |     MODIFY
Add cluster monitoring access rights to the kibana user, and refresh the privileges cache.
INSERT INTO elastic_admin.privileges (role,actions,indices) VALUES ('kibana','cluster:monitor/.*','.*');
SELECT * FROM elastic_admin.privileges;

 role   | actions            | indices | fields | query
--------+--------------------+---------+--------+-------
 kibana | cluster:monitor/.* |      .* |   null |  null
Finally, Kibana user accounts must have :
- the SELECT permission on vizualized indices, especially on your default kibana index.
- the SELECT permission on the kibana keyspace to read kibana configuration.
- the MODIFY permission on the kibana keyspace to store kibana configuration if authorized to create/update kibana objects.
Tip
Once a user if authenticated by kibana, kibana keeps this information. In order to logout from your browser, clear cookies and data associated to your kibana server.
Kibana and Content-Based Security
As explain in the cassandra documentation, you can grant a role to another role and create a hierarchy of roles. Then you can gives some elasticsearch privileges to a base role inherited by some user roles allowed to login, and specify a query filter or field-level filter to this base role.
In the following example, the base role group_a have read access to index my_index with a document-level filter defined by a term query. Then the user role bob (allowed to log in) inherits of the privileges from the base role group_a to read the kibana configuration and the index my_index only for documents where category is A.
REVOKE SELECT ON KEYSPACE my_index FROM kibana;
CREATE ROLE group_a WITH LOGIN = false;
GRANT SELECT ON KEYSPACE "_kibana" to group_a;
INSERT INTO elastic_admin.privileges (role, actions, indices, query) VALUES('group_a','indices:data/read/.*','my_index', '{ "term" : { "category" : "A" }}');
CREATE ROLE bob WITH PASSWORD = 'bob' AND LOGIN = true;
GRANT group_a TO bob;
Don’t forget to refresh the privileges cache by issuing the following command :
POST /_aaa_clear_privilege_cache
Elasticsearch Spark connector
The elasticsearch-hadoop connector can access a secured Elassandra cluster by providing the sames SSL/TLS and Username/Pasword authentication parameters as the orginal elasticsearch-hadoop connector. Here is an example with a spark-shell.
ES_OPTS="$ES_OPTS --conf spark.es.nodes=127.0.0.1"
ES_OPTS="$ES_OPTS --conf spark.es.net.ssl=true"
ES_OPTS="$ES_OPTS --conf spark.es.net.ssl.truststore.location=file:///path/to/truststore.jks"
ES_OPTS="$ES_OPTS --conf spark.es.net.ssl.truststore.pass=*******"
ES_OPTS="$ES_OPTS --conf spark.es.net.http.auth.user=john"
ES_OPTS="$ES_OPTS --conf spark.es.net.http.auth.pass=*******"

bin/spark-shell --driver-class-path path/to/elasticsearch-hadoop-5.5.0.jar $ES_OPTS
In order to works, the elasticsearch spark connector requires privileges to monitor your cluster and request for availables shards for search.
You can associate these privileges to a dedicated cassandra role spark, and grant this role to the account used in your spark application.
The spark role have no cassandra permission, but user john inherits its privileges from the elastic_admin.privileges table.
CREATE ROLE spark;
INSERT INTO elastic_admin.privileges (role,actions,indices) VALUES ('spark','cluster:monitor/.*','.*');
INSERT INTO elastic_admin.privileges (role,actions,indices) VALUES ('spark','indices:admin/shards/search_shards','.*');
SELECT * FROM elastic_admin.privileges WHERE role='spark';

 role   | actions                            | indices | fields | query
--------+------------------------------------+---------+--------+-------
  spark |                 cluster:monitor/.* |      .* |   null |  null
  spark | indices:admin/shards/search_shards |      .* |   null |  null

(2 rows)
GRANT spark TO john;
LIST ROLES of john;

 role  | super | login | options
-------+-------+-------+---------
 spark | False | False |        {}
  john | False |  True |        {}

(2 rows)
Cassandra Spark Connector
The cassandra-spark-connector can request both Cassandra and Elasticsearch through the CQL driver.
Elasticsearch Auditing
Elasticsearch auditing tracks security events with the following fields :
| Field | Description |
|---|---|
| status | GRANTED(200), UNAUTHORIZED(401), FORBIDDEN(403), BLOCKED(409) |
| type | PRIVILEGE, PERMISSION, UNAUTHORIZED, UNSUPPORTED, TAMPERED |
| login | User login |
| role | Cassandra role |
| source | Source IP of the elasticsearch request |
| action | Elasticsearch action |
| indices | Requested indices |
Audits events are recorded in a Cassandra table or in a log file configured as an appender in your conf/logback.xml file.
| Setting | Default | Description |
|---|---|---|
aaa.audit.enabled |
false | Enable or disable Elasticsearch auditing. |
aaa.audit.appender |
none | Audits events are recorded in a Cassandra table (cql) or in a logback appender (log). |
aaa.audit.include_login |
Comma separated list of logins to audit | |
aaa.audit.exclude_login |
Comma separated list of logins not audited |
Logback Audit
When using the log appender for audit, you should configure a dedicated logback appender in your conf/logback.xml file :
<appender name="AUDIT" class="ch.qos.logback.core.rolling.RollingFileAppender">
   <file>${cassandra.logdir}/audit.log</file>
   <rollingPolicy class="ch.qos.logback.core.rolling.FixedWindowRollingPolicy">
      <fileNamePattern>${cassandra.logdir}/audit.log.%i.zip</fileNamePattern>
      <minIndex>1</minIndex>
      <maxIndex>20</maxIndex>
   </rollingPolicy>
   <triggeringPolicy class="ch.qos.logback.core.rolling.SizeBasedTriggeringPolicy">
      <maxFileSize>500MB</maxFileSize>
   </triggeringPolicy>
   <encoder>
      <pattern>%date{ISO8601} %msg%n</pattern>
   </encoder>
</appender>
And add a logger named LogbackAuditor with additiviy set to false :
<logger name="LogbackAuditor" level="DEBUG" additivity="false" >
     <appender-ref ref="AUDIT" />
</logger>
Here an exemple of audit logs in the logs/audit.log file :
2017-10-20 14:11:49,854 200,PERMISSION,sales,roles/sales,/10.0.1.5,indices:data/read/search,[sales_*]
2017-10-20 14:11:51,607 200,PERMISSION,sales,roles/sales,/10.0.1.5,indices:data/read/search,[.kibana]
2017-10-20 14:11:52,377 200,PRIVILEGE,kibana,roles/kibana,/10.0.1.5,cluster:monitor/main,null
2017-10-20 14:11:52,501 200,PRIVILEGE,kibana,roles/kibana,/10.0.1.5,cluster:monitor/nodes/info,null
2017-10-20 14:11:52,627 200,PRIVILEGE,kibana,roles/kibana,/10.0.1.5,cluster:monitor/nodes/info,null
2017-10-20 14:11:52,679 200,PERMISSION,sales,roles/sales,/10.0.1.5,indices:data/read/mget[shard],[.kibana]
2017-10-20 14:11:52,751 200,PERMISSION,kibana,roles/kibana,/10.0.1.5,indices:data/read/mget[shard],[.kibana]
2017-10-20 14:11:52,868 200,PRIVILEGE,kibana,roles/kibana,/10.0.1.5,cluster:monitor/health,[.kibana]
2017-10-20 14:11:52,990 200,PERMISSION,kibana,roles/kibana,/10.0.1.5,indices:data/read/search,[.kibana]
CQL Audit
When using the cql appender for audit, audit events are recorded in the cassandra table elastic_audit.events.
cassandra@cqlsh> select * from elastic_audit.events ;

 node     | event                                | action                        | indices     | level      | login  | role         | source   | status
----------+--------------------------------------+-------------------------------+-------------+------------+--------+--------------+----------+--------
 10.0.0.4 | cf74fed0-b5a2-11e7-9508-157b11ac2561 |          cluster:monitor/main |        null |  PRIVILEGE | kibana | roles/kibana | 10.0.1.5 |    200
 10.0.0.4 | d2026070-b5a2-11e7-9508-157b11ac2561 |         cluster:monitor/state |        null |  PRIVILEGE | kibana | roles/kibana | 10.0.1.5 |    200
 10.0.0.4 | da709470-b5a2-11e7-9508-157b11ac2561 |      indices:data/read/search | ['sales_*'] | PERMISSION |  sales |  roles/sales | 10.0.1.5 |    200
 10.0.0.4 | d8025390-b5a2-11e7-9508-157b11ac2561 |        cluster:monitor/health | ['.kibana'] |  PRIVILEGE | kibana | roles/kibana | 10.0.1.5 |    200
 10.0.0.4 | cf9de390-b5a2-11e7-9508-157b11ac2561 |    cluster:monitor/nodes/info |        null |  PRIVILEGE | kibana | roles/kibana | 10.0.1.5 |    200
If you want to have multiple copies of audit events in your cluster, you can alter the following default settings :
| Setting | Default | Description |
|---|---|---|
aaa.audit.cql.rf |
1 | Cassandra Replication Factor used when creating the elastic_audit keyspace. |
aaa.audit.cql.cl |
LOCAL_ONE | Write Consistency Level for audit events. |
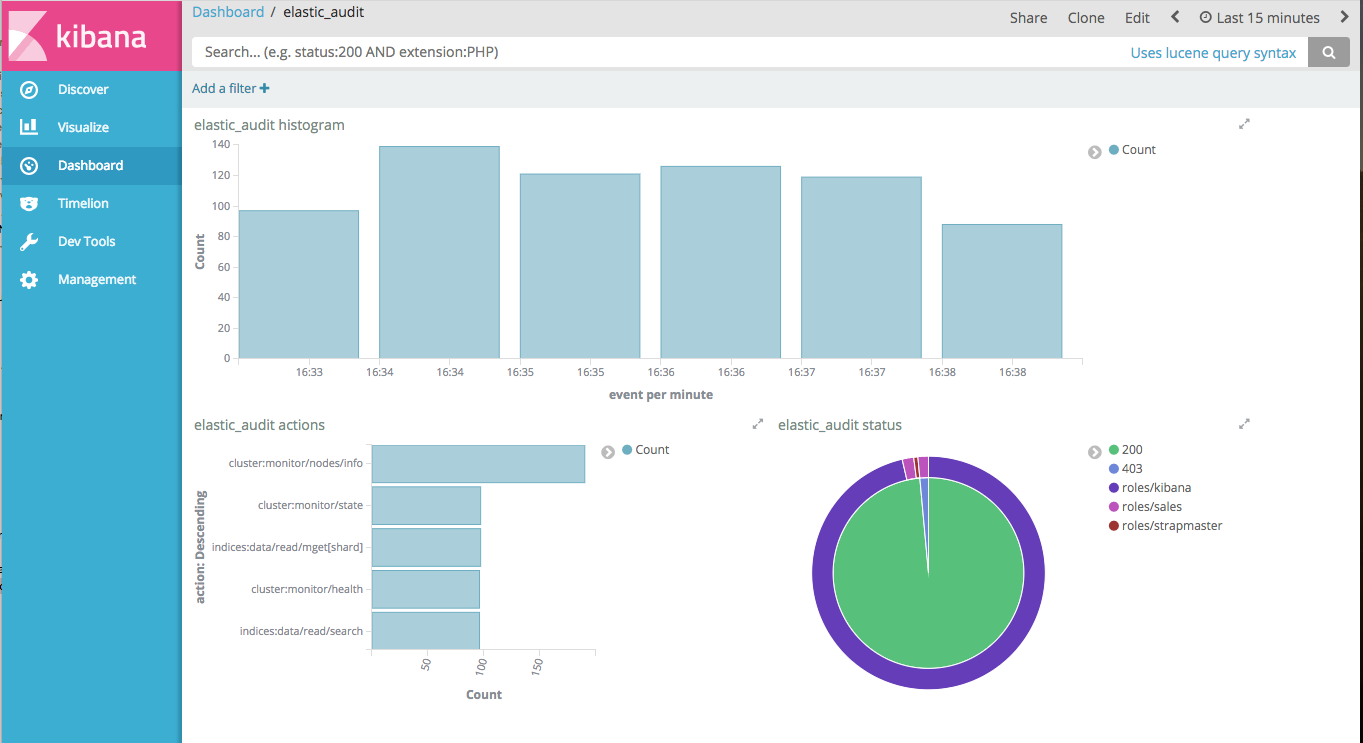
You can index with elasticsearch the elastic_audit.events table with the following mapping, where the event timeuuid column is explicitly mapped to a date :
curl -XPUT --user admin:admin --cacert conf/cacert.pem "https://localhost:9200/elastic_audit/" -d'
{
   "mappings":{
      "events":{
         "discover":"^((?!event).*)",
         "properties":{
            "event":{
               "type":"date",
               "cql_collection":"singleton"
            }
         }
      }
   }
}'
Then you can build you audit trail kibana report.
Tip
Keep in mind that CQL audit trail involves a network overhead because each node send some events to all other nodes. For better performances, you should use the Logback audit and collect events with Beat+Logstash into a dedicated elassandra cluster.
Limitations
Content-Based Security Limitations
The request cache is disabled for search requests.
The following queries are not supported for document-level filtering :
- Has Parent, Has Child queries.
- Terms queries with lookups.
- Geo Shape queries without inline shape definition.
- Percolate queries.
If you try to insert an unsupported query in elastic_admin.privileges.query, you will get a syntax error as show bellow :
cassandra@cqlsh> insert into elastic_admin."privileges" (role,actions,indices,query) VALUES ('blogger','indices:data/read/.*','blog','{ "has_parent":{"parent_type":"blog","query":{"term":{"tag":"something"}}}}');
SyntaxException: Unsupported query for content-based filtering